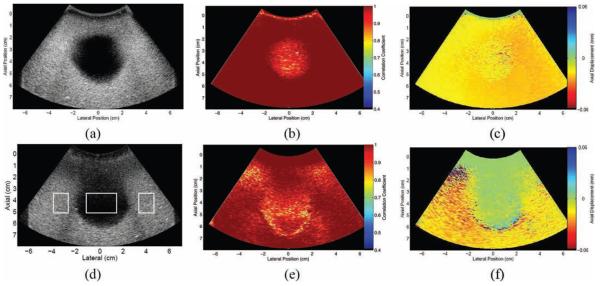
Fig. 3.
Bladder phantom: (a) B-mode image; corresponding maps of (b) correlation coefficients and (c) axial displacements between 2 consecutive frames in the data set; (d) B-mode image of bladder phantom with clutter-generating layer placed at the transducer surface (the boxes show regions of interest used to calculate contrast and contrast-to-noise ratios in reference and filtered data); and corresponding maps of (e) correlation coefficients and (f) axial displacements between 2 consecutive frames in the data set. Displacements are relative to the transducer surface, where negative indicates motion toward the transducer and positive indicates motion away from the transducer.

