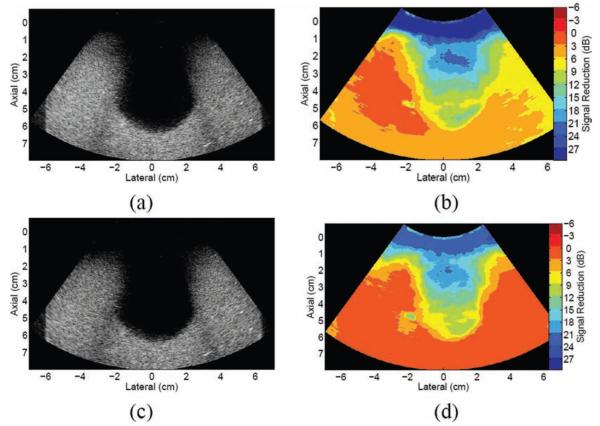
Fig. 4.
Single frame results of the motion filters applied to the phantom data: (a) finite impulse response (FIR)–filtered image; (b) corresponding map of regional magnitude reductions in the FIR-filtered image, when compared with the reference image in Fig. 3(d); (c) blind source separation (BSS)–filtered image; and (d) corresponding map of regional magnitude reductions in the BSS-filtered image, when compared with the reference image in Fig. 3(d).

