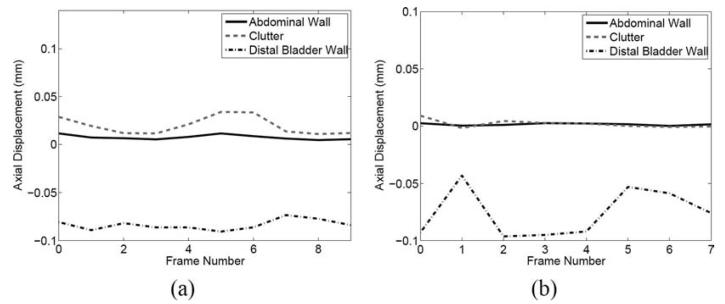
Fig. 6.
Average axial displacements of select regions in displacement maps of consecutive fundamental (a) and harmonic (b) images. The regions of interest used to calculate average displacements are shown in Figs. 5(d) and (j), respectively. Displacements are relative to the transducer surface, where negative indicates motion toward the transducer and positive indicates motion away from the transducer.

