Figure 4.
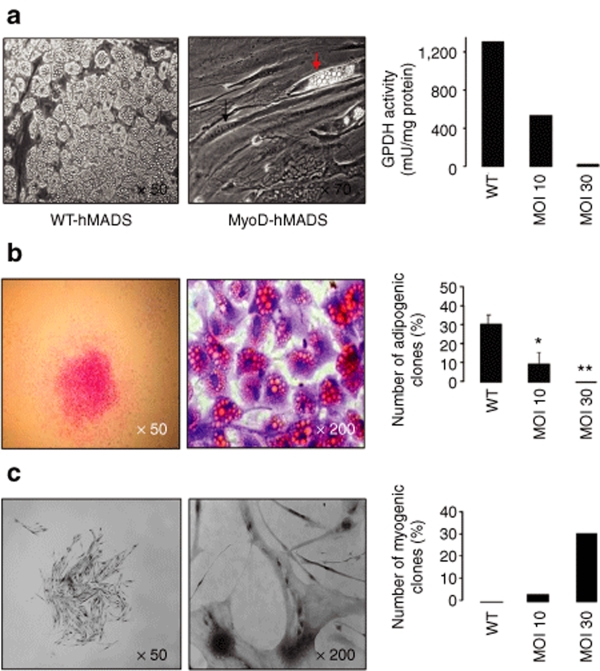
Differentiation potential of MyoD-hMADS cells. (a) The adipogenic differentiation potential was compared between WT- and MyoD-hMADS cells. The phase-contrast microscope views show typical fields of WT- and MyoD-hMADS cells (MOI 30) subjected to adipogenic culture conditions for 2 weeks. Adipocytes are characterized by the presence of tiny lipid droplets in their cytoplasm. They cover the entire culture dish with WT-hMADS cells, while they are very rare with MyoD-hMADS cells (red arrow). The MyoD-hMADS cells could also be found as multinucleated myotubes (black arrow), in accordance with the very close adipogenic and myogenic culture conditions. The histogram visualizes a representative experiment comparing the GPDH adipocyte marker activity between WT- and MyoD-hMADS cells at the indicated MOI. (b) A single clone in adipogenic differentiation medium is shown at low and high magnification after Oil Red O staining for triglycerides. The histogram compares the percentage of adipogenic clones in WT- and MyoD-hMADS cells according to MOI; n = 5; *P = 0.05 and **P = 0.001. (c) For comparison, the same clonal analysis as in b is shown in myogenic differentiation medium. The low magnification picture is a phase-contrast view of a single myogenic clone and the high magnification picture shows nuclei labeled with an anti-MyoD antibody revealed by peroxydase staining. As opposed to the adipogenic clones, the histogram of this representative experiment shows that the percentage of myogenic clones drastically increases with the MOI level. hMADS, human multipotent adipose-derived stem; MOI, multiplicity of infection; GPDH; glycerol-3-phosphate dehydrogenase; WT, wild type.

