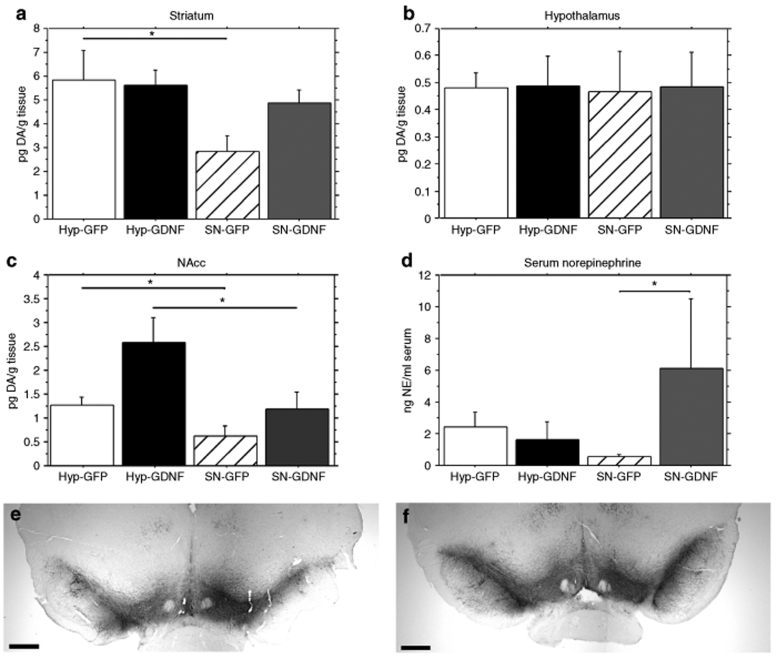
Figure 6.
Catecholamine analysis. (a) DA analysis of the striatum indicated a slightly lower DA content in the SN-GFP (n = 7) injected animals as compared to the hyp-GFP group (n = 6) (P < 0.05 by ANOVA) and the SN-GDNF group (n = 6) (P = 0.07). (b) No differences were observed in hypothalamic DA content in-between the various groups. (c) DA content in the NAcc was significantly elevated in the hyp-GDNF group when compared to the SN-GDNF group, in addition, the hyp-GFP group contained slightly higher DA levels when compared to the SN-GFP control (P < 0.05 by ANOVA). (d) Evaluation of serum norepinephrine content indicated a significant increase in the SN-GDNF group when compared to the GFP control (P < 0.05 by ANOVA). (e,f) Low power photomicrographs showing no GDNF-induced alteration of nigral TH expression. TH immunoreactivity in animal injected in the (e) SN with rAAV2/5-GDNF, and (f) rAAV2/5-GFP f. Bars in e,f = 1 mm. ANOVA, analysis of variance; DA, dopamine; GDNF, glial cell line–derived neurotrophic factor; GFP, green fluorescent protein.

