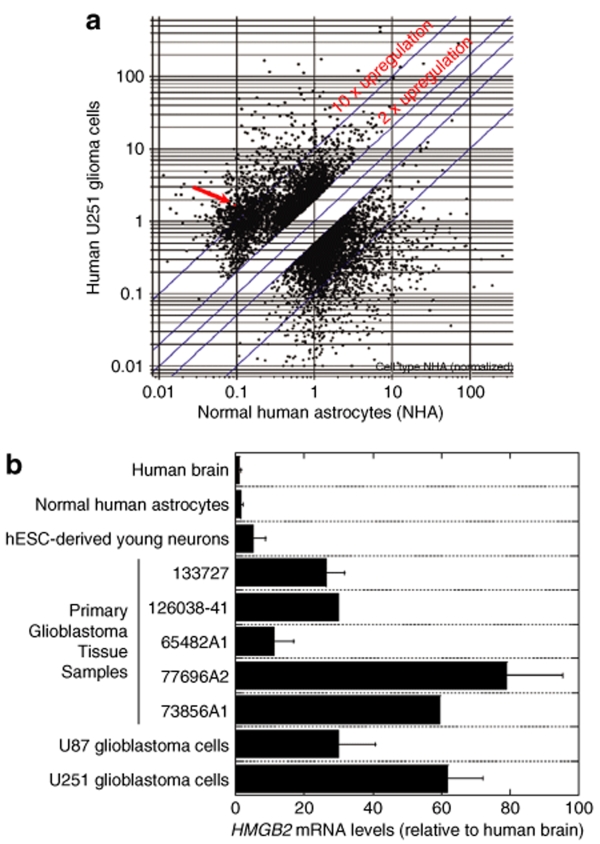
Figure 1.
Expression of HMGB2 mRNA in brain tissues and cells. (a) DNA microarray analysis of HMGB2 mRNA levels in U251 glioblastoma cells and normal human astrocytes. Three replicate Affimetrix HG_U133A_Plus_2 GeneChip arrays were used for each type of cells. Microarray results were analyzed using GeneSpring GX 7.3. The arrow indicates HMGB2 mRNA expression levels, which were low in normal human astrocytes, but more than tenfold upregulated in U251 glioblastoma cells. (b) Real-time PCR quantification of HMGB2 mRNA expression. Normal human brain tissue, primary glioblastoma tissues, normal human astrocytes and neurons, and U87 and U251 glioblastoma cell lines were used. hESC-derived young neurons were collected 1 week after neuronal differentiation of neural stem cells generated from hES1 human embryonic stem cells. The values represent the fold change in HMGB2 expression, normalized to β-actin mRNA levels and relative to HMGB2 expression in the normal brain tissue (means ± SD, n = 2–6). HMGB2, human high mobility group box2; mRNA, messenger RNA; hESC, human embryonic stem cells.

