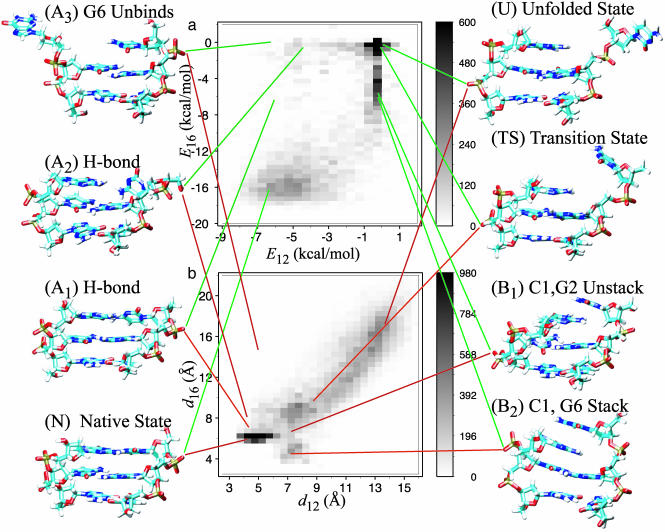
Fig. 2.
The frequency of observing values of the order parameters during 1,650 TPS trajectories. The structures shown next to the plots are snapshots taken from the TPS simulations except A3, which was taken from an umbrella sampling simulation. Note that the gray scale has been cut off at 600 (a) and 980 (b) such that regions with smaller frequencies can be seen. (a) Frequency of observing E12 and E16. (b) Frequency of observing d12 and d16.

