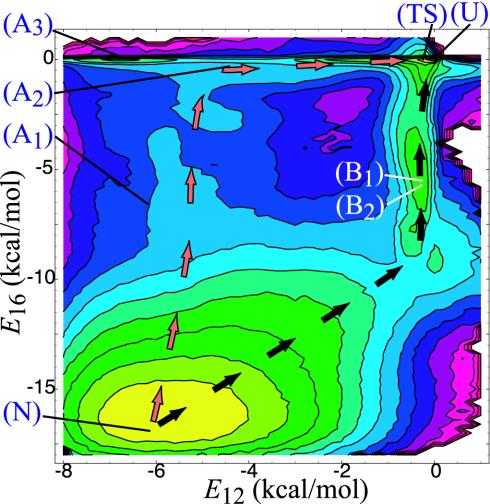
Fig. 3.
Projection of free energy onto E12 and E16 (contour lines are separated by 0.5 kcal/mol). The letters overlayed on the plots correspond to the location of the structures depicted in Fig. 2. The arrows were drawn by hand to indicate the two predominant paths discussed in the text.

