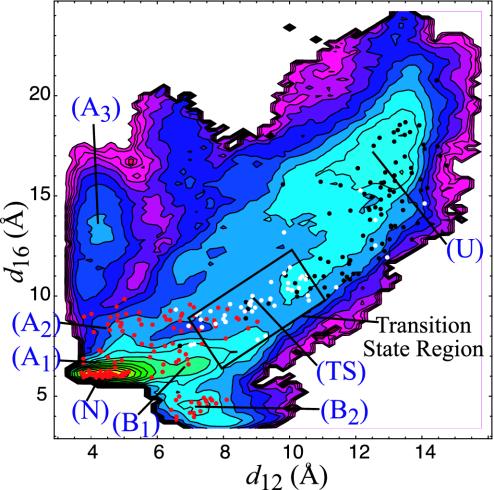
Fig. 4.
Projection of free energy onto d12 and d16 (contour lines are separated by 0.5 kcal/mol). The points overlayed on the plot correspond to the structures from which the committors were estimated. Color coding: red, tends not to unfold (0 ≤ Pu < 0.35); white, “transition state” (0.35 ≤ Pu ≤ 0.65); black, tends to unfold (0.65 < Pu ≤ 1.0). During the estimation, the unfolded state was defined as d12 > 10.75 and d16 > 11. Only structures that reached a stable state were counted in the estimation of Pu. The other stable states were defined as the native state (d12 < 9.0; 5.5 < d16 < 8.0), G6 unfolds (d12 < 7.0; 8.0 < d16 < 18), and the stacked state (6.0 < d12 < 9.0; d16 < 5.5). The region marked with the rectangle has been identified as the “transition state region” (see Fig. 5). The qualitative distribution of committor values and location of the transition-state region are relatively insensitive to the definitions of the stable and transition states.

