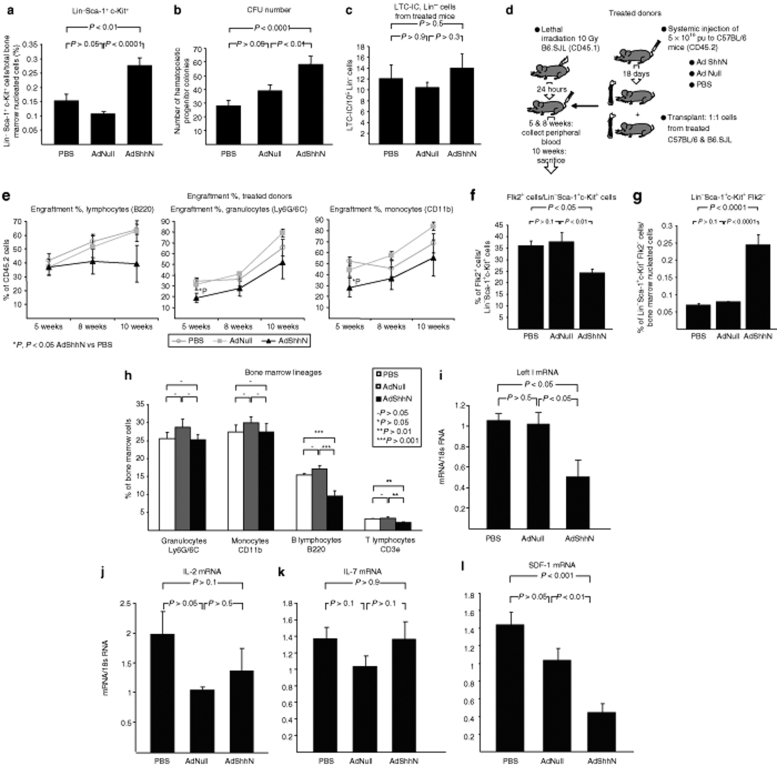
Figure 3.
Increase in primitive bone marrow hematopoietic compartment and decrease in bone marrow B and T lymphocytes by elevated levels of Sonic hedgehog (Shh). (a) Percentage of Lin− Sca-1+ c-Kit+ (LSK) cells/total bone marrow nucleated cells (n = 9, each condition). Femoral bone marrow cells were harvested 18 days after AdShhN vector administration and stained with antibodies against lineage markers (CD3e for T cells, CD11b for monocytes, CD45R for B cells, TER119 for erythrocytes, Ly6G/6C for granulocytes; combination of all markers defined as “Lin”) and antibodies against stem cell markers Sca-1 and c-Kit and analyzed by flow cytometry. (b) Number of hematopoietic progenitor colonies assessed by colony-forming unit assay (n = 5 each condition, each sample in triplicate). Femoral bone marrow cells were harvested 18 days after AdShhN vector administration and plated in methylcellulose medium for colony-forming unit assay. (c) Long-term culture-initiating cell (LTC-IC) assay. Lin− bone marrow cells were isolated from bone marrow of phosphate-buffered saline (PBS) (n = 4), AdNull (n = 4), or AdShhN-treated (n = 4) mice 18 days after vector administration and plated on irradiated naive bone marrow stromal cells in limiting dilutions in LTC-IC assays. (d,e) Competitive repopulation assay. B6.SJL (CD45.1) mice were lethally irradiated and transplanted with a 1:1 mixture of bone marrow cells from C57BL/6 (CD45.2) mice treated 18 days before with PBS, AdNull, or AdShhN and wild-type B6.SJL mice (PBS cells, n = 4; AdNull cells, n = 4; AdShhN cells, n = 5). (d) Schematic representation of the experimental design; and (e) percentage of donor cells in different lineages in peripheral blood 5 and 8 weeks after transplantation and in bone marrow 10 weeks after transplantation. (f,g) Flk2 expression in the LSK population. (f) Flk2+ cells/LSK cells; and (g) percentage of Flk2− LSK cells/total bone marrow nucleated cells. (h) Percentage of hematopoietic lineages in the bone marrow. Bone marrow cells were stained with antibodies against lineage markers (Ly6G/6C for granulocytes, CD11b for monocytes, CD45R for B cells, and CD3e for T cells) and analyzed by flow cytometry (n = 9, each condition). (i–l) Bone marrow mRNA expression of regulators of lymphoid development. (i) Lef1, (j) IL-2, (k) IL-7, and (l) SDF-1. RNA was extracted from bone marrow cells and relative quantification of gene expression was analyzed by TaqMan real-time PCR (PBS, n = 5; AdNull, n = 4; AdShhN, n = 5). For a–c and e–l, data shown as mean ± SE. Ad, adenovirus; IL-2, interleukin 2; Lef1, lymphoid enhancer–binding factor 1; SDF-1, stromal-derived growth factor 1.

