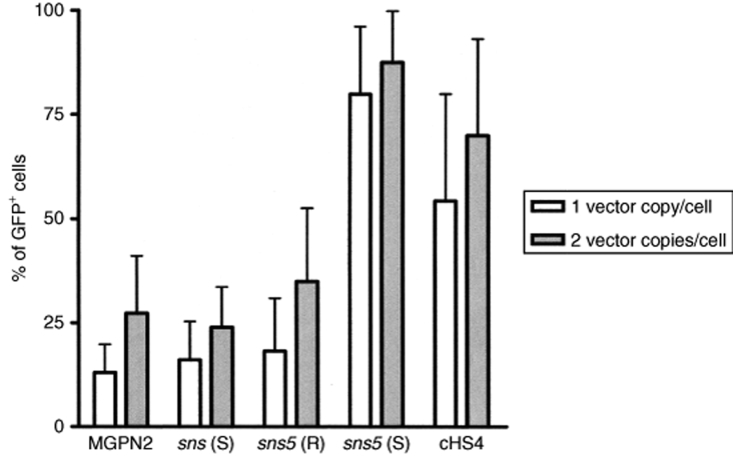
Figure 4.
Percentages of GFP+ cells in individual mouse erythroleukemia clones. The frequency of fluorescent cells was measured, 30 days after cell expansion, in individual clones bearing one or two copies of vector. In this analysis, 11–15 clones carrying one copy (white bars) and 18–24 clones carrying two copies (gray bars) of proviruses are included. The diagram represents the mean of GFP+ cell percentages ± SD.

