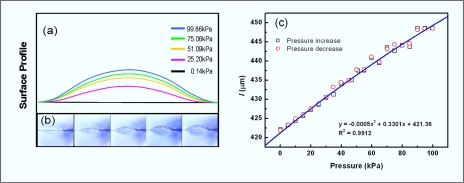
Figure 5.
Surface profile and the length of the sensor under increasing pressure. (a) Portrait of surface profile from (b) under different pressures. (b) Real-time picture of the thin membrane with pressure load. The pressure sensor embedded in the center. (c) Plot of length vs pressure measured from (a).

