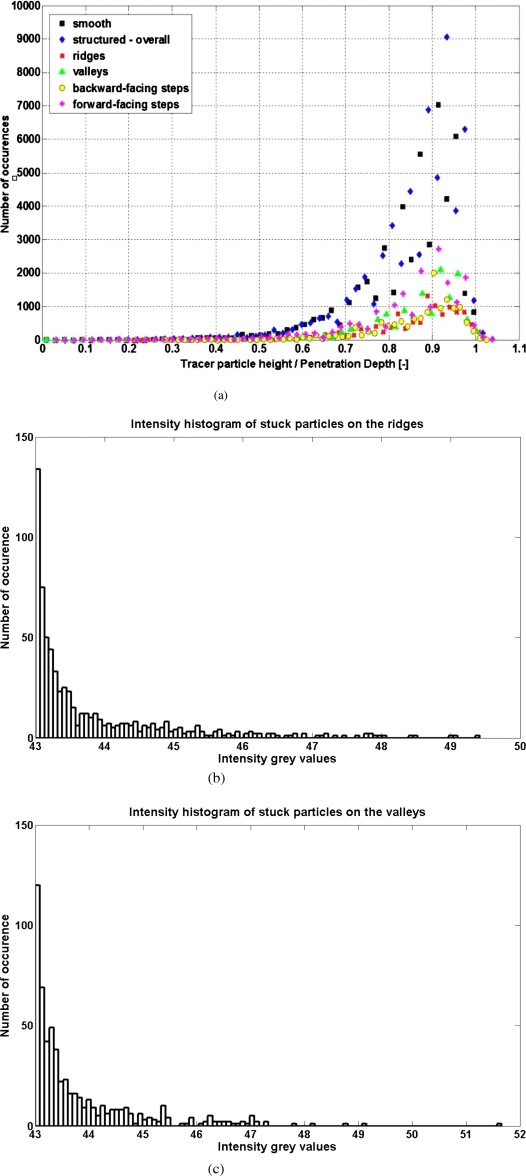
Figure 7.
(a) The distribution of the particles distance z from the PDMS surfaces. Only a few tracer particles are detected for z less than ∼0.5 d, while the tracer particles located at z larger than ∼d have intensities levels comparable to CCD noise and are eliminated in the image analysis; [(b) and (c)] the intensity histogram of particles stuck on the ridges and the valleys, respectively.

