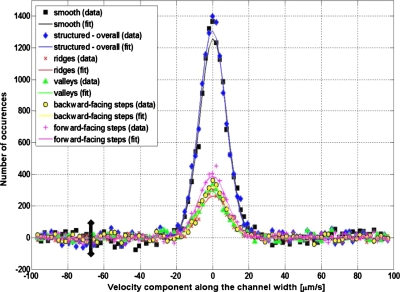
Figure 8.
The distributions of the velocity components along the channel width, estimated from the measured particle displacements; the lines are Gaussian curves (centered on approximately the zero velocity) fitted on the experimental data, indicating that we have properly tracked correlated particle displacements (rather than uncorrelated noise), and that there is no net flow along these two directions, such that the tracer particle displacements are only due to the Brownian motion. The error bar gives an estimate of the experimental error.

