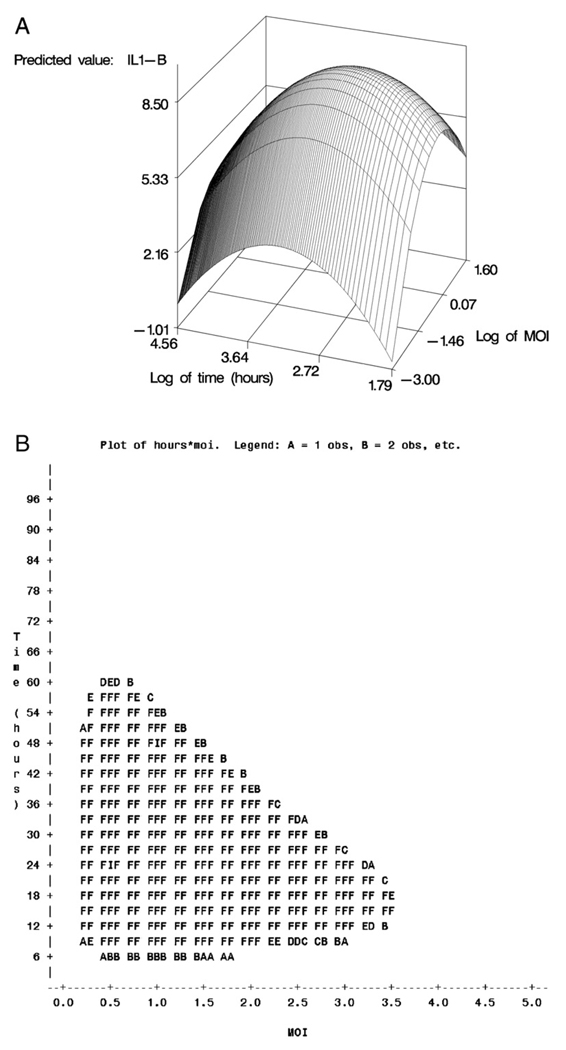
Fig. 2.
A). Response surface for vaccinia-specific IL-1β response of PBMC stimulated with inactive vaccinia virus. Panel A depicts the three-dimensional response surface, plotting time and MOI on the log scale, as originally included in the regression analysis. The maximum response value for this surface occurred at a time of 19 h and an MOI of 0.7. B). Response surface for vaccinia-specific IL-1β response of PBMC stimulated with inactive vaccinia virus. The shaded region of Panel B displays all combinations of time and MOI with resulting responses falling within one standard error of the maximum. All such values can be considered statistically equivalent to the maximum. For ease of interpretation, time and MOI values for Panel B are reported in their original (that is, back-transformed) sampling units.

