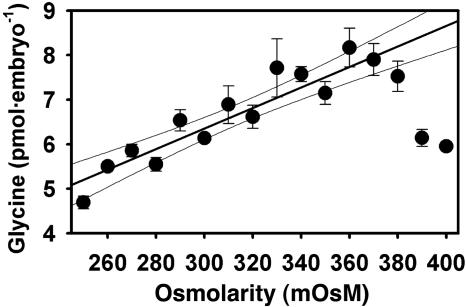
Fig. 1.
Total glycine in mouse embryos after 24-h culture from the one-cell stage in 1 mM glycine as a function of osmolarity. The line shown was obtained by linear regression (excluding data >380 mOsM where decrease likely reflects loss of viability; r2 = 0.85; 95% confidence intervals indicated). Each point represents mean ± SEM of three replicates.

