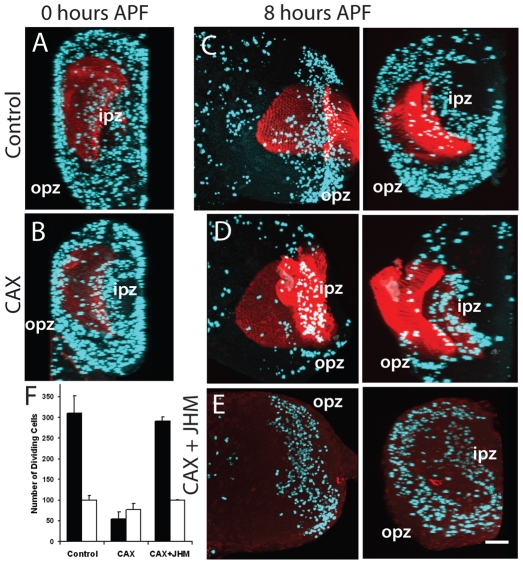
Fig. 4.
Precocious decline in proliferation in the OL in Aug21>grim allatectomized (CAX) prepupae and its prevention by feeding larvae on diet containing 1 ppm pyriproxyfen (JHM). (A-E) The OL at different times (hours) APF of (A,C) CyO, UAS-grim (control) prepupae, (B,D) CAX prepupae after feeding on normal diet, and (E) a CAX prepupa after feeding on the JHM diet. (C-E) Frontal z-projection of the optic lobe (left) and a 90° projection along the x-axis (right), showing an end-on view to discriminate the inner (ipz) and outer (opz) proliferation zones; (A,B) x-axis projections. Aqua represents PH3 staining of mitotic cells; red is chaoptin staining of the incoming photoreceptors, except in E where it was omitted. Scale bar: 50 μm. (F) Mean number (±s.d.) of proliferating cells in the opz (black bars) and the ipz (white bars) of 3-5 animals at 8 hours APF.

