Fig. 5.
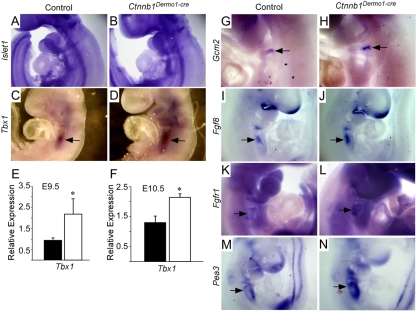
Upregulation of the Tbx1 signaling pathway in Ctnnb1Dermo1-Cre embryos. (A,B) Wholemount ISH of lsl1 at E9.5 showing no difference in Isl1 expression between control and Ctnnb1Dermo1-Cre embryos. (C,D) Wholemount ISH of Tbx1 at E9.5 showing increased expression in the pharyngeal arches (arrows) in Ctnnb1Dermo1-Cre (D) compared with control (C) embryos. (E,F) Quantitative RT-PCR analysis showing increased Tbx1 expression in Ctnnb1Dermo1-Cre embryos (white bar) compared with control (black bar) at E9.5 (E) and E10.5 (F). (G,H) Wholemount ISH of Gcm2 (arrows) at E10.5 showing increased expression in Ctnnb1Dermo1-Cre (H) compared with control (G) embryos. (I,J) Wholemount ISH of Fgf8 at E9.5 showing increased expression in pharyngeal arches (arrow) in Ctnnb1Dermo1-Cre (J) compared with control (I) embryos. (K,L) Wholemount ISH of Fgfr1 at E10.5 showing increased expression in pharyngeal arches (arrows) in Ctnnb1Dermo1-Cre (L) compared with control (K) embryos. (M,N) Wholemount ISH of Pea3 at E9.5 showing increased expression in pharyngeal arches (arrows) in Ctnnb1Dermo1-Cre (N) compared with control (M) embryos. *, P<0.04 in E; *, P<0.005 in F.

