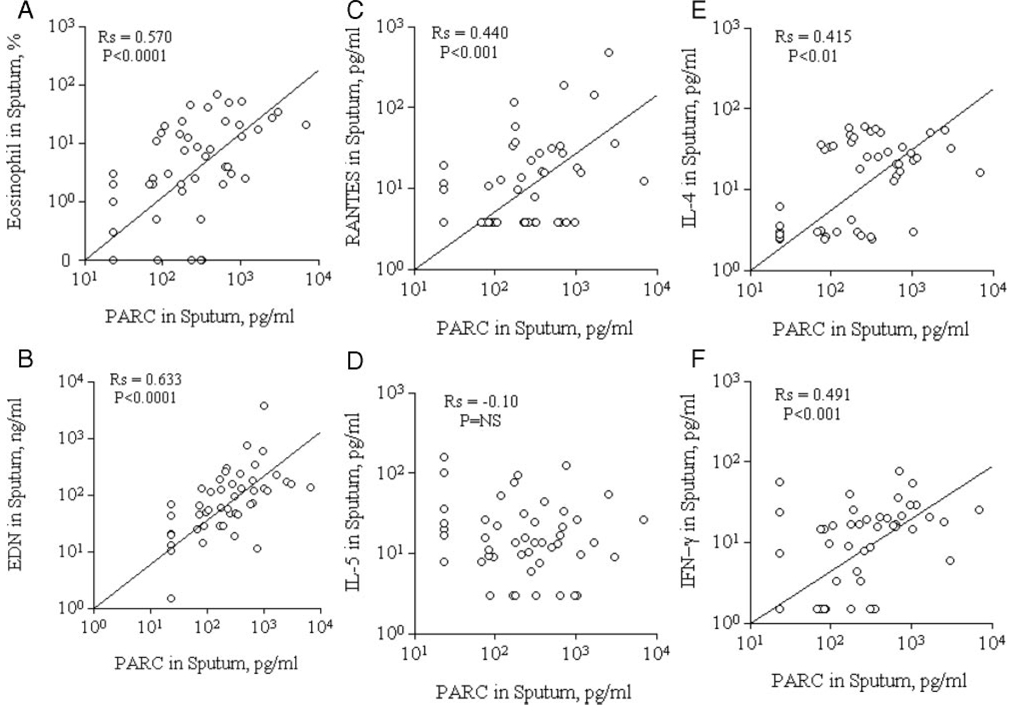
FIGURE 3.
PARC levels, eosinophil inflammatory markers, and cytokines/chemokines in sputum specimens. Correlations are shown between PARC levels and eosinophils (top left, A), EDN (bottom left, B), RANTES (top middle, C), IL-5 (bottom middle, D), IL-4 (top right, E), and IFN-γ (bottom right, F) in sputum specimens.

