
Figure 2.
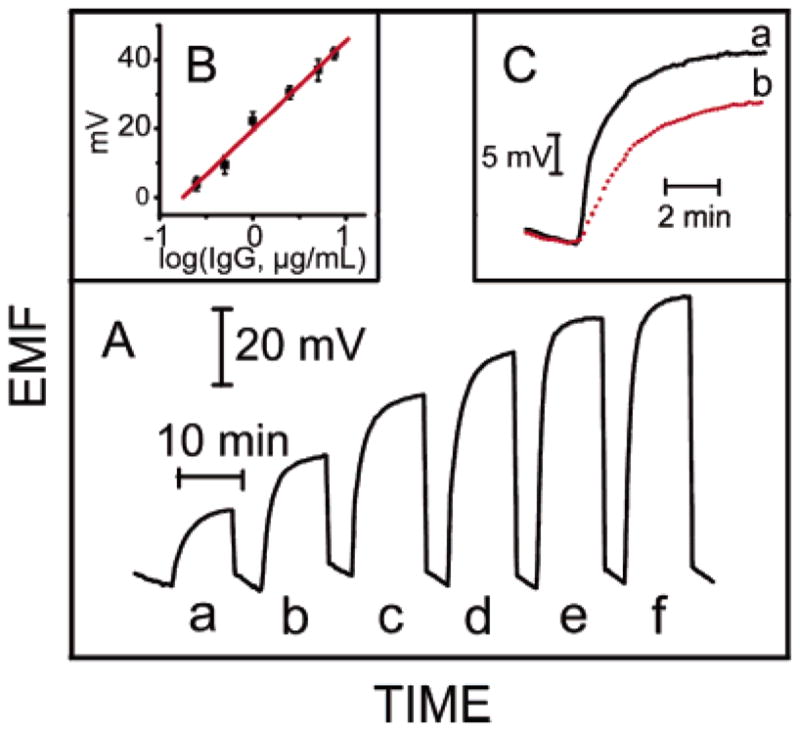
Potentiometric responses of silver ion-selective electrode for increasing levels of the mouse IgG target: 0 (a), 0.5 (b), 1 (c), 2.5 (d), 5 (e), and 7.5 (f) μg/mL mouse IgG (A). Inset: calibration curve of the silver ISE responses versus log[IgG] (B), and the potentiometric responses of silver ion-selective electrode for (a) 0.25 μg/mL mouse IgG and (b) control (C).