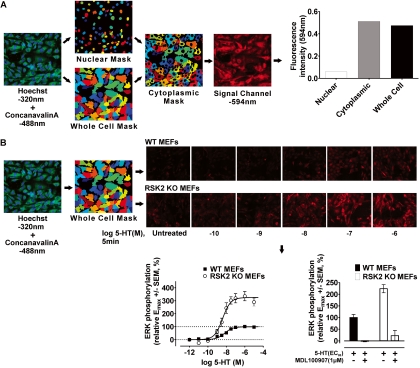
Fig. 1.
Development of a novel triple-fluorescence high-content microscopic assay in 384-well plates to rapidly measure ERK1/2 phosphorylation in WT and RSK2 KO MEFs. A, diagram showing stepwise generation of nuclear (Hoechst 320), whole-cell (concanavalin-A 488), and cytoplasmic cell masks subsequently used to measure fluorescence intensity of the signal channel (594 nm) in distinct cellular regions. This approach incorporates the nearly limitless application of state-specific antibodies (e.g., phospho-specific) and fluorescently labeled proteins to quantify receptor responses. Moreover, segmenting the cell into distinct regions allows us to extract a variety of signaling phenotypes with customizable CellProfiler image analysis software. B, the triple-fluorescence technique was used to generate full concentration-response curves for ERK1/2 phosphorylation in WT and RSK2 KO MEFs after 5-min agonist treatment. The workflow shown here describes the steps used to measure ERK1/2 phosphorylation (594 nm, see representative images) within whole-cell masks after 5-HT treatment. Concentration-response curves for 5-HT-induced ERK1/2 phosphorylation in WT (■) and RSK2 KO (○) MEFs highlight the robustness (Z′ factor = 0.54) and reproducibility of the triple-fluorescence technique. Values represent the mean ± S.E.M. of 18 independent experiments performed in duplicate. Also shown are representative results (bottom right, mean ± S.E.M.) in which the 5-HT2A-selective antagonist MDL-100907 (1 μM) blocked the response to 5-HT (EC80 concentration). Identical results were obtained for all agonists at both cell lines (data not shown).

