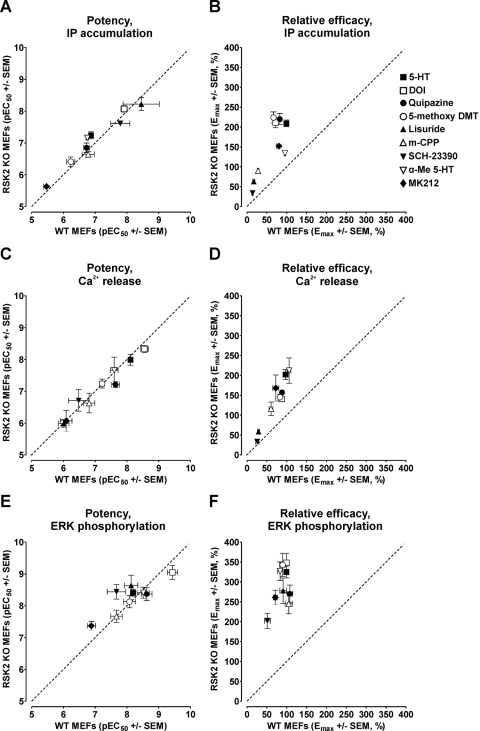
Fig. 3.
The relative efficacies of 5-HT2A receptor agonists are globally augmented by genetic deletion of RSK2. Agonist potencies (pEC50) and relative efficacies (Emax) for IP accumulation (A and B), Ca2+ release (C and D), and ERK phosphorylation (E and F) in WT and RSK2 KO MEFs were plotted as X–Y correlations. Relative to a line of identity (dashed line), Emax values were consistently higher in RSK2 KO MEFs, whereas pEC50 values were similar between cell lines. Emax and pEC50 values were calculated via nonlinear regression as reported in Tables 1 to 3. Values represent the mean ± S.E.M. of three to six independent experiments performed in duplicate. Agonists tested were 5-HT (■), DOI (□), quipazine (●), 5-methoxy-DMT (○), lisuride (▴), m-CPP (▵), SCH-23390 (▾), α-Me-5-HT (▿), and MK212 (♦).

