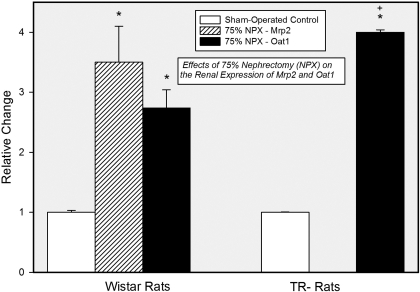
Fig. 1.
Results from real-time PCR analyses of the expression of Mrp2 and Oat1 in samples of combined renal cortex and outer stripe of the outer medulla from SO and 75% NPX Wistar and TR− rats 14 days after surgery. ∗ indicates significantly different (p < 0.05) from corresponding control. + indicates significantly different (p < 0.05) from the corresponding mean obtained from Wistar rats.

