Fig. 1.
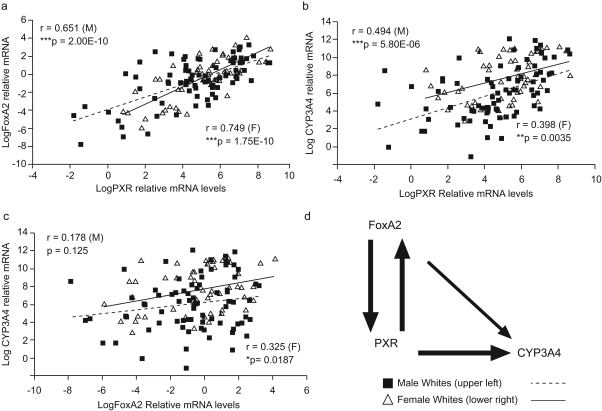
Correlation plots for mRNA expression of hepatic PXR, FoxA2, and CYP3A4. PXR, FoxA2, and CYP3A4 mRNA levels were determined by use of Taqman-based gene expression assays. Scatter plots indicate correlations between the relative mRNA levels for each gene in males (■) and females (▵). a, FoxA2 and PXR. b, CYP3A4 and PXR. c, CYP3A4 and FoxA2. The p values and correlation coefficient are indicated. d, regulatory relationship between FoxA2, PXR, and CYP3A4 suggested by the correlation values. The strength of correlation between the mRNA expression values is represented by the thickness of the arrows.

