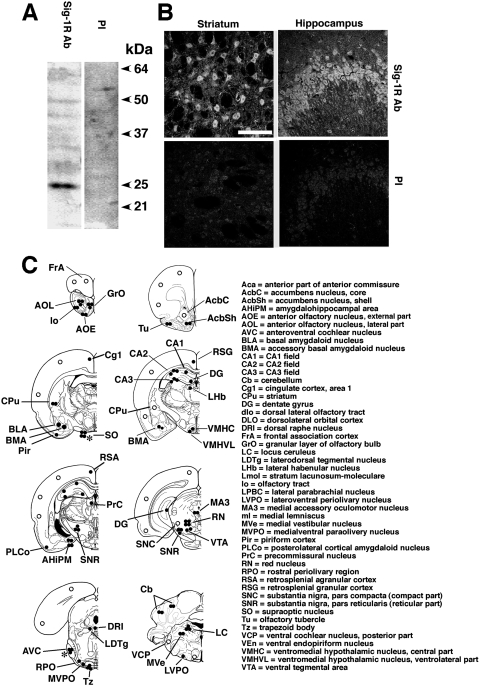
Fig. 1.
Immunospecificity of the anti-σ-1 receptor (Sig-1R) antibody. A, Western blotting of rat brain protein lysates. Twenty micrograms of protein lysates from rat cortex was separated by 13% SDS-polyacrylamide gel electrophoresis and transblotted to a polyvinylidene difluoride membrane. Proteins were probed by either anti-Sig-1R antibody (Sig-1R Ab) or preimmune serum (PI) at a 1:750 dilution. The specific band with the 25-kDa molecular mass was detected. B, Sig-1R immunoreactivity in the rat striatum (left) or the hippocampal CA3 region (right). Top shows immunoreactivity derived from an anti-Sig-1R Ab (1:50). Bottom is from preimmune serum (1:50). Scale = 100 μm. C, schematic representation of the distribution of Sig-1R immunoreactivity in coronal sections of the rat brain. Intensities of immunoreactivities are ranked by the number of closed circles. The open circles indicate moderate expression. ∗, expression levels in pregnant rats.

