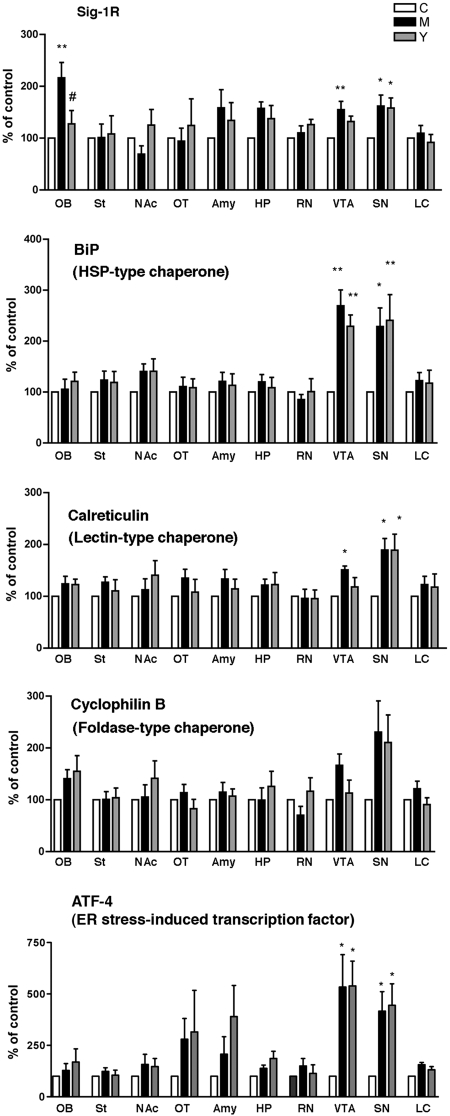
Fig. 6.
Effect of methamphetamine self-administration on expression levels of ER chaperones. Protein levels of each molecular chaperone were measured by Western blotting. Data are shown as percentage of animals receiving saline (control). ∗∗, p < 0.01, ∗, p < 0.05 compared with control (n = 6/group). Data analyzed by one-way ANOVA followed by Tukey's multiple comparison test. See Materials and Methods for details in the sample preparation. C, yoked saline control; M, methamphetamine self-administration; Y, yoked methamphetamine control. OB, olfactory bulb; St, striatum; NAc, nucleus accumbens; OT, olfactory tubercle; Amy, basolateral amygdala; HP, dorsolateral hippocampus; RN, red nucleus; SN, substantia nigra (compacta and reticulata); LC, locus ceruleus.

