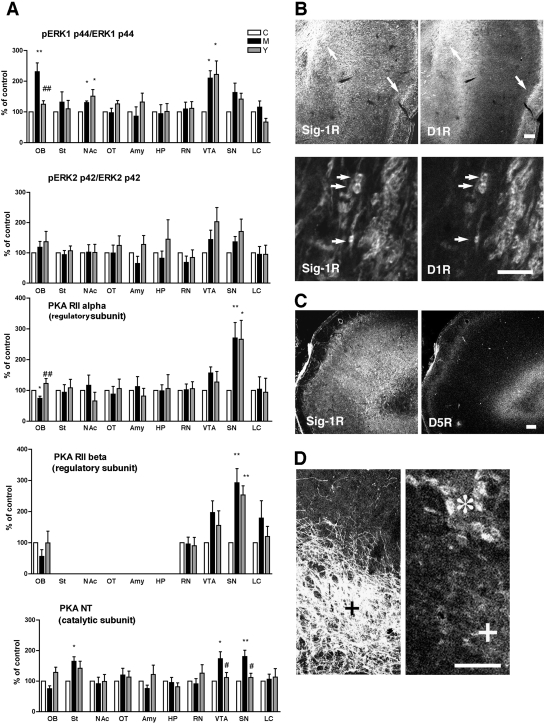
Fig. 7.
Effect of methamphetamine self-administration on expression levels of PKA or phosphorylation of ERK. Protein levels or phosphorylation were measured by Western blotting. Data are shown as percentage of animals receiving saline (control). ∗∗, p < 0.01, p < 0.05 compared with control (n = 6/group). Data analyzed by one-way ANOVA followed by Tukey's multiple comparison test. See Materials and Methods for details of the sample preparation. C, yoked saline control; M, methamphetamine self-administration; Y, yoked methamphetamine control. OB, olfactory bulb; St, striatum; NAc, nucleus accumbens; OT, olfactory tubercle; Amy, basolateral amygdala; HP, dorsolateral hippocampus; RN, red nucleus; SN, substantia nigra (compacta and reticulata); LC, locus ceruleus. B, localization of σ-1 receptors (Sig-1Rs) with D1R in the olfactory bulb. Arrows indicate the potential colocalization between Sig-1Rs and D1R seen at lower magnification of AOL (left) and anterior olfactory nucleus, external part (right) regions. Bottom two panels are at the higher magnification of the AOL region. Note the clear localization of Sig-1Rs in cell bodies of D1R-postive neurons. C, no colocalization of Sig-1Rs with dopamine D5 receptors (D5R) in the olfactory bulb. D, expression of Sig-1Rs in tyrosine hydroxylase-positive VTA neurons (+). ∗, large neurons in the red nucleus positive to Sig-1R immunoreactivity. Scale = 300 μm (B, top, and C), and 100 μm (B, bottom, and D).

