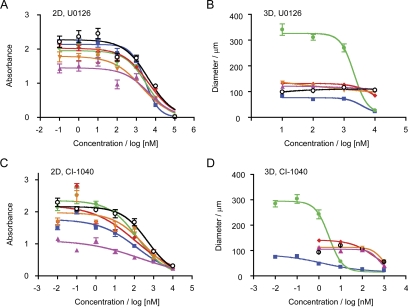
Fig. 3.
Dose-dependent analysis of growth inhibition of MCF10 variants by MEK inhibitors in 2D and 3D culture. A and C, cells were cultured in 96-well plates for 3 days with the indicated concentrations of U0126 or CI-1040 and subjected to MTT assay. B and D, cells were cultured for 9 days in 3D rBM overlay cultures with the indicated concentrations of U0126 or CI-1040 and the size of structures measured. The cell lines assayed were MCF10A, black open circles; MCF10.NeoT, magenta triangles; MCF10.AT1, orange triangles; MCF10.DCIS, red diamonds; MCF10.H-Ras, green circles; and MCF10.N-Ras, blue squares. Data shown are mean ± S.E.M. (n = 3).

