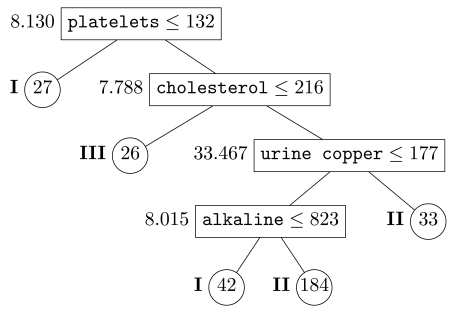
Figure 3.
The Best-Sized Interaction Tree for the PBC Data. For each internal node denoted by a box, the splitting rule is given inside the box. Observations satisfying the condition proceed to the left node while observations not satisfying the condition proceed to the right node. To the left of each internal node is the PLRT statistic G. Terminal nodes are denoted by circles and ranked with Roman numerals on the left. The node size (i.e., number of observations) is given inside the circle.

