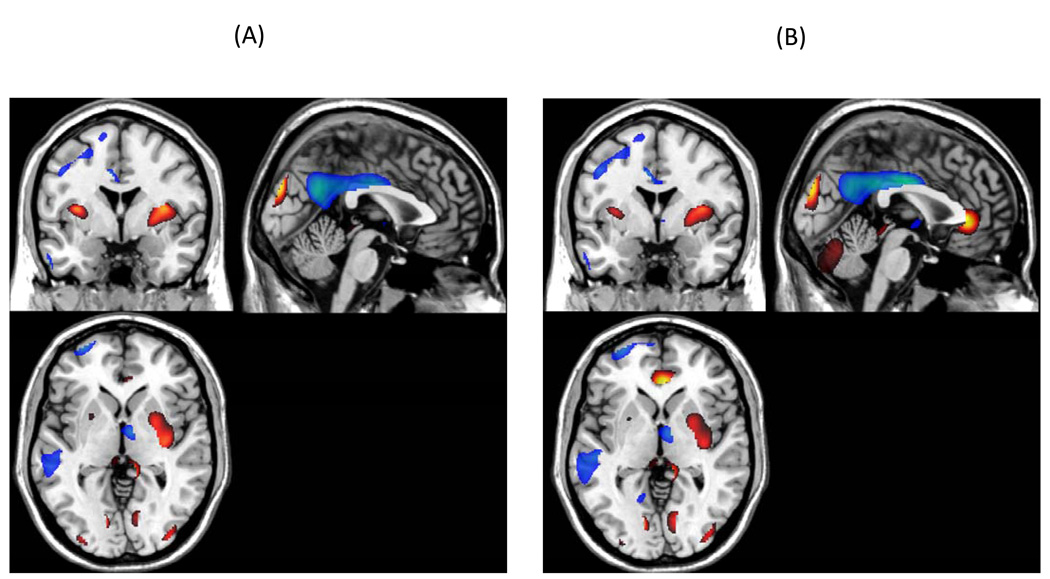
Figure 6.
Bootstrap Z-map of the horizontal, axial, and sagittal view of the brain regions involved in the AD-related covariance pattern (above the 2.00 threshold, implying an one-tailed p-level of .03) are presented in Panel A and the AD-related pattern, after removing the age effect, is presented in Panel B. Positive factor loadings, indicating an AD-related increase in CBF, are represented in “hot” colors.

