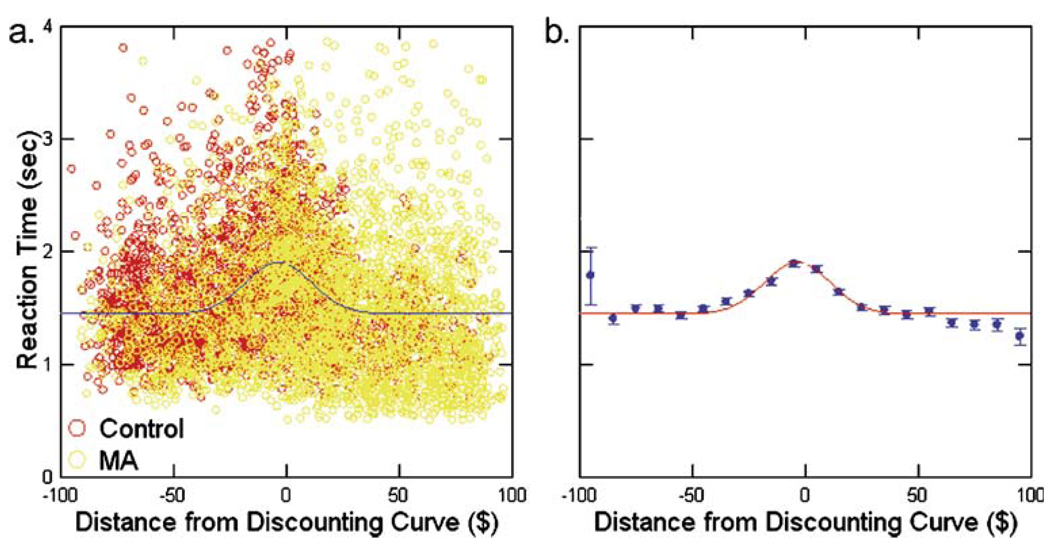
Fig. 1.
Distribution of reaction times to DD choices as a function of distance from the discounting curve. a Shows the distribution of the raw reaction times and b that of the means in bins $10 wide. The non-linear regression fit of Eq. 2 to the mean values was good (corrected R2=0.661)

