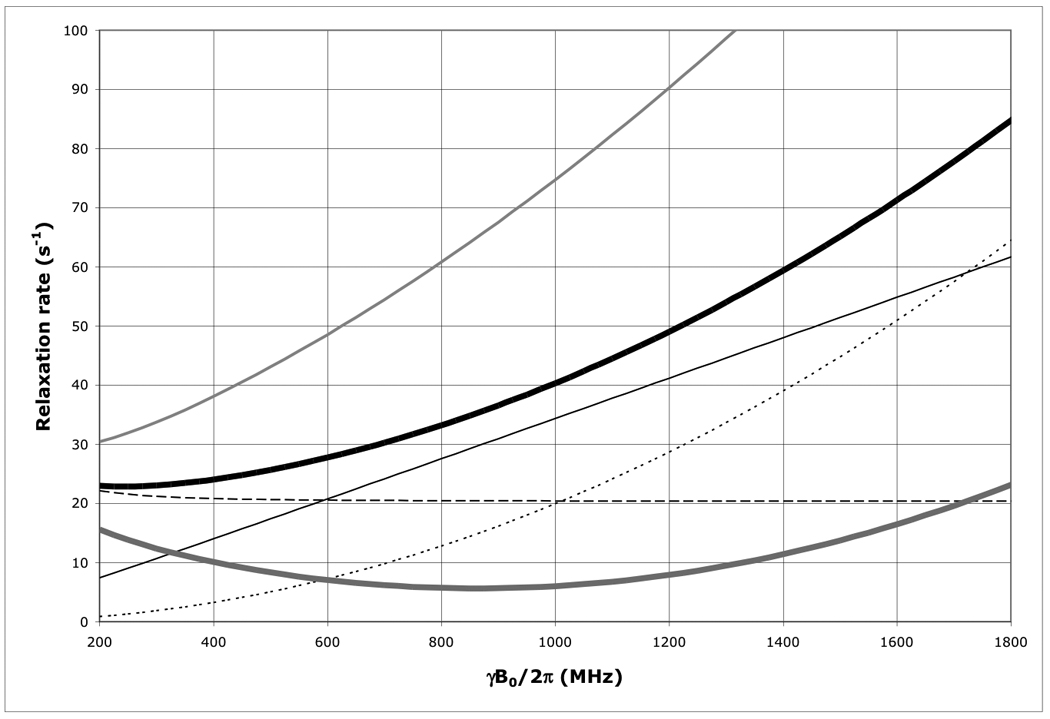
Figure 1.

The field dependence of the protein 15N TROSY effect for τc=22 ns calculated using an rhombic 15N CSA tensor with σ11=230, σ22=87 and σ33=60 ppm, with σ1117 deg off the NH-bond of 1.04 Å using Eqs. (1–4).
Thick solid line: total 15N R2 as encountered in a HSQC or HMQC; Thick dashed line: 15N R2 due to 15N-1H dipolar relaxation; Thin dashed line: 15N R2 due to 15N CSA relaxation; Thin grey line: the 15N R2 15N-1H dipolar / 15N CSA cross correlated relaxation rate; Thick grey line: 15N R2 as encountered in a TROSY (i.e. total 15N R2 minus 15N R2 15N-1H dipolar / 15N CSA cross correlation). Thin grey line: 15N R2 of the anti-TROSY line (i.e. total 15N R2 plus 15N R2 15N-1H dipolar / 15N CSA cross correlated relaxation rate).
