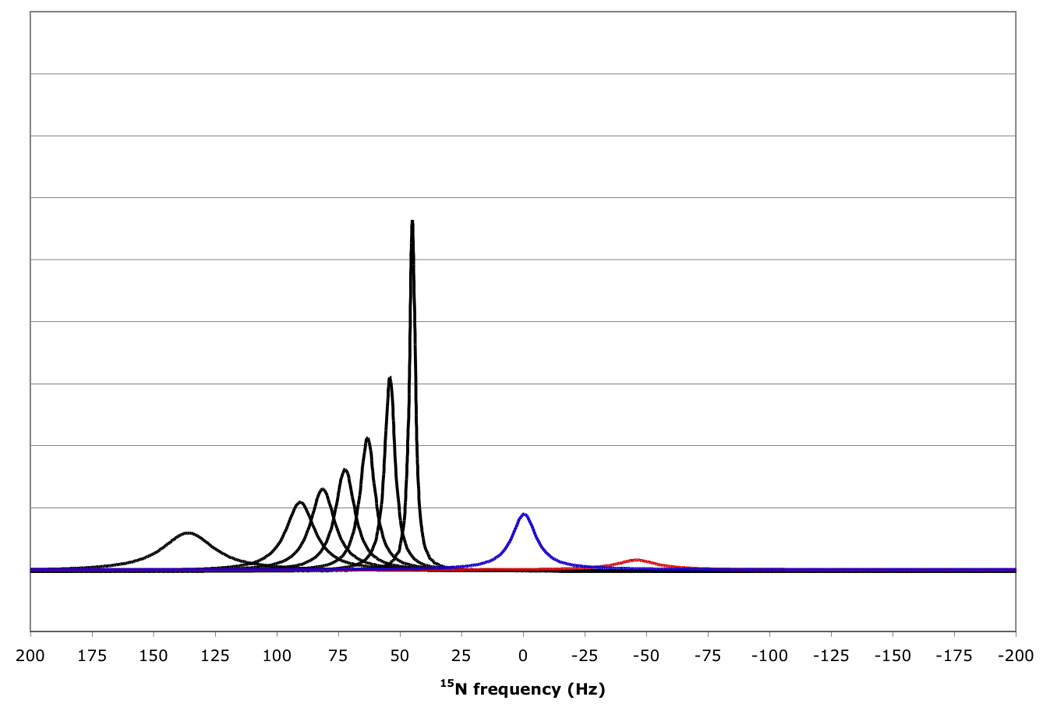
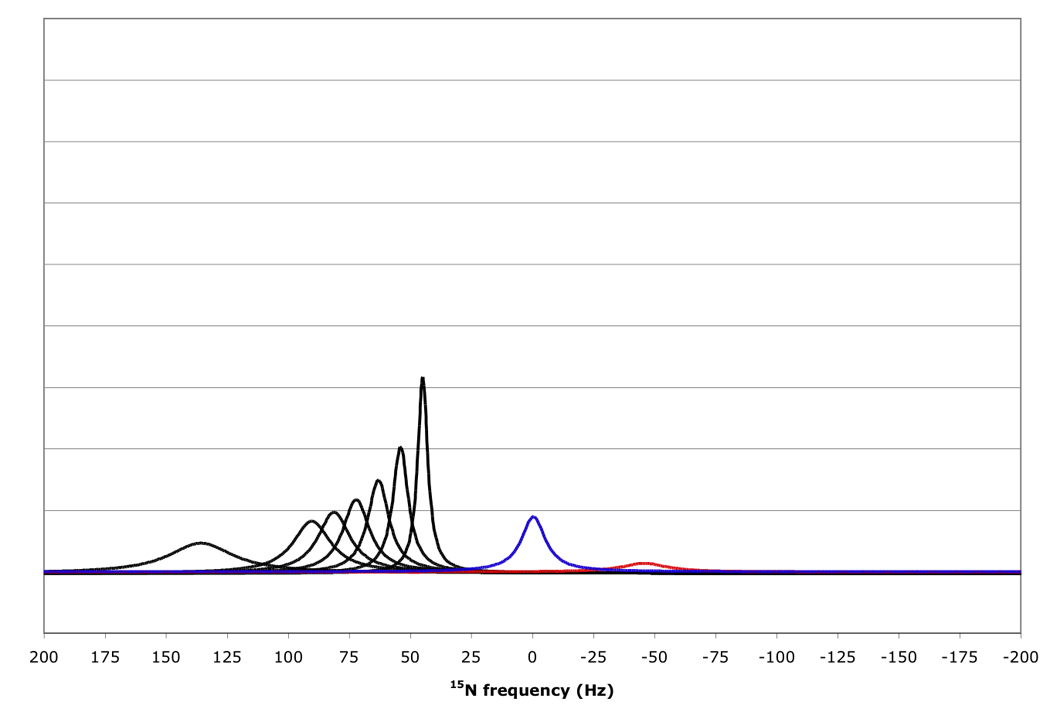
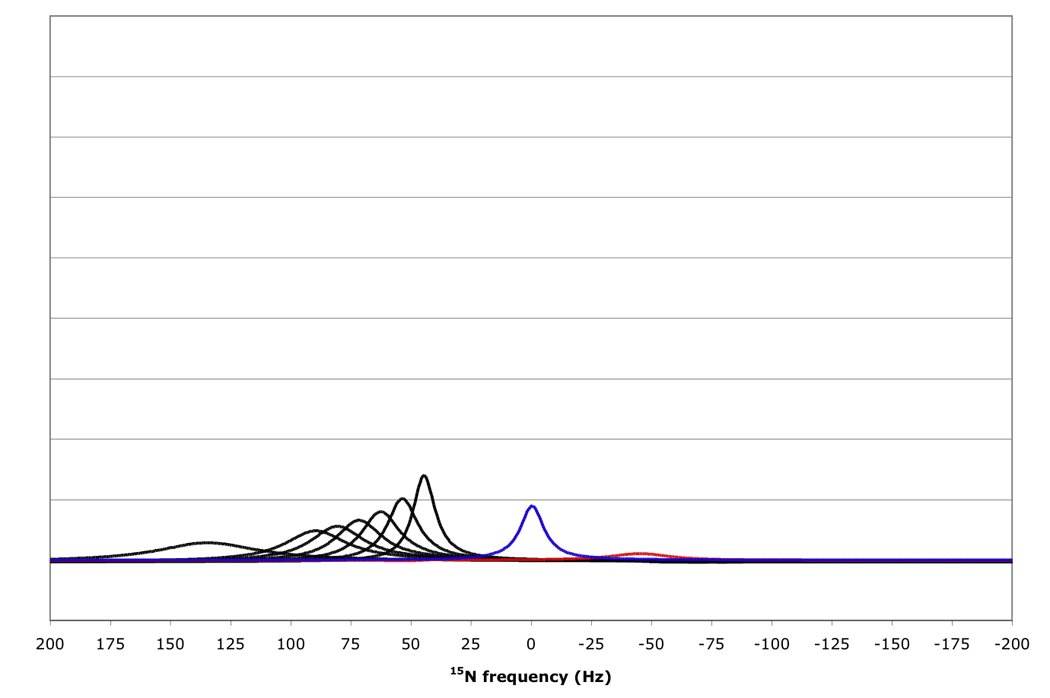
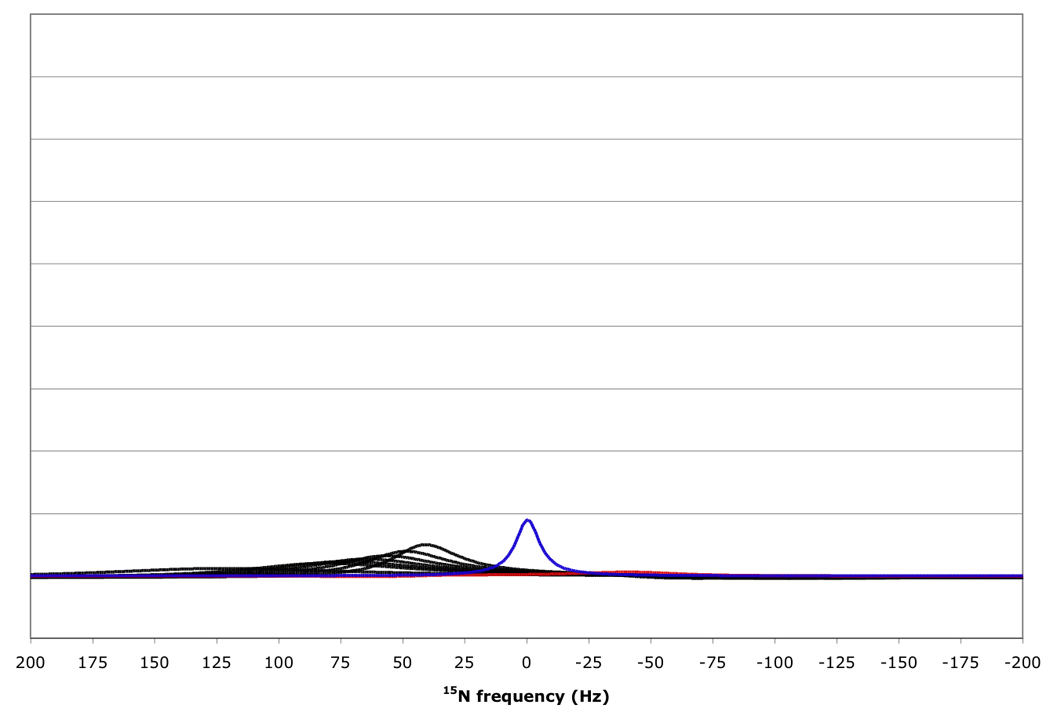
Figure 10.


15N resonance positions, intensities and linewidths for the NH doublet components in various RDC-TROSY experiments, calculated for protein with τc=22 ns, at 800 MHz 1H. Color coding and scaling is the same as in Fig 8.
From top to bottom: kαβ=kβα=3 s−1; 10 s−1; 30 s−1; 100 s−1.
