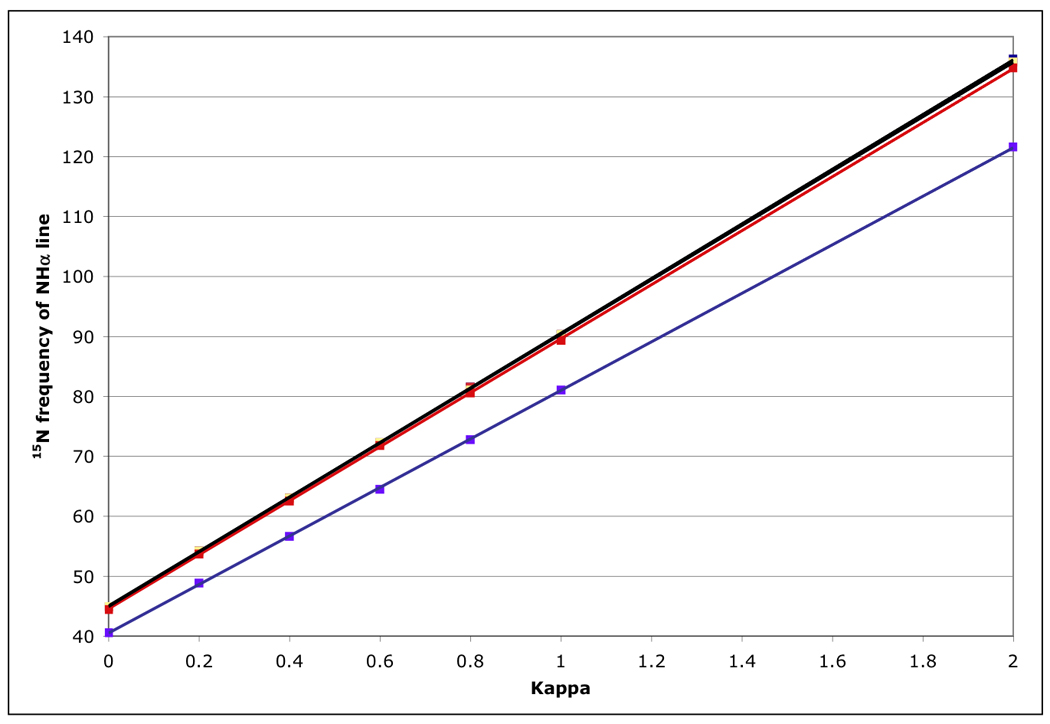
Figure 11.

15N peak frequency for the NHα (TROSY) line, calculated for a protein with τc=22 ns, at 800 MHz 1H for the RDC-TROSY experiments. The lines in the figure are least squares fits, with slopes of 45.63, 45.39, 45.37, (all black) 45.08 (red) and 40.5 (blue) Hz / unit of κ for kαβ=0, 3, 10, 30 and 100 s−1, respectively.
