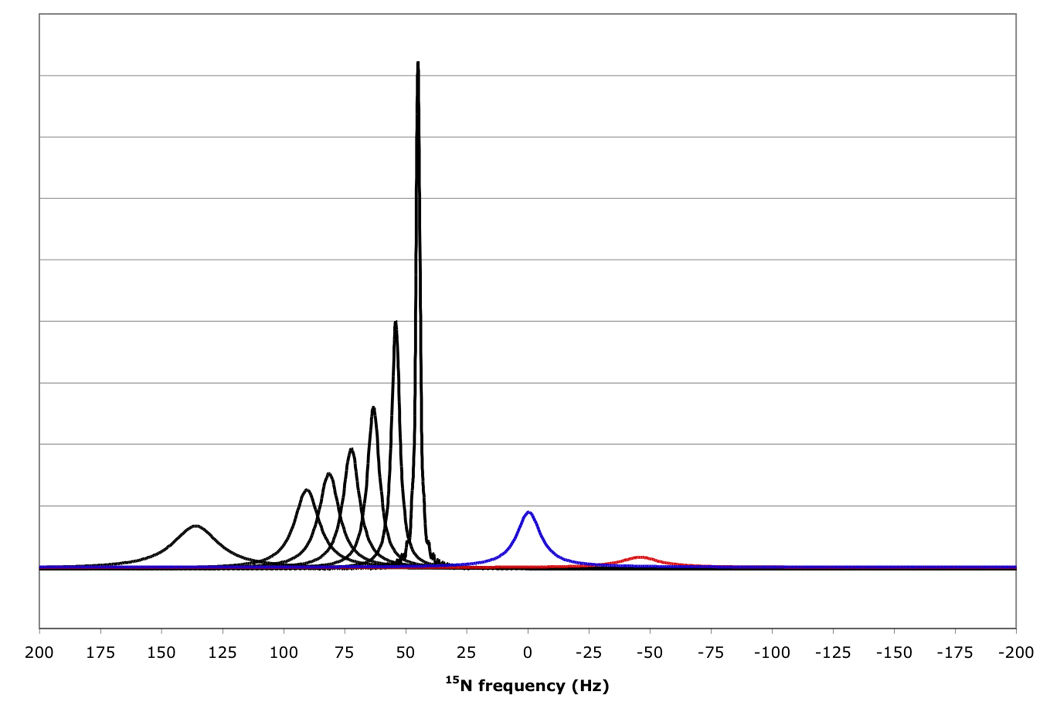
Figure 8.

15N resonance positions, intensities and linewidths for the NH doublet components in various experiments, calculated for protein with τc=22 ns, at 800 MHz 1H, no amide proton flips.
In black, RDC-Trosy peaks, with κ values of 0, 0.2, 0.4, 0.6, 0.8, 1.0 and 2.0 from right to left.
In red, the anti-TROSY peak, scaled down by a factor of 5 due to additional broadening in the 1H dimension (see Fig 7); in blue, the HSQC peak with intrinsic double intensity, but scaled down by a factor of 3 due to additional broadening in the 1H dimension (see Fig 7).
