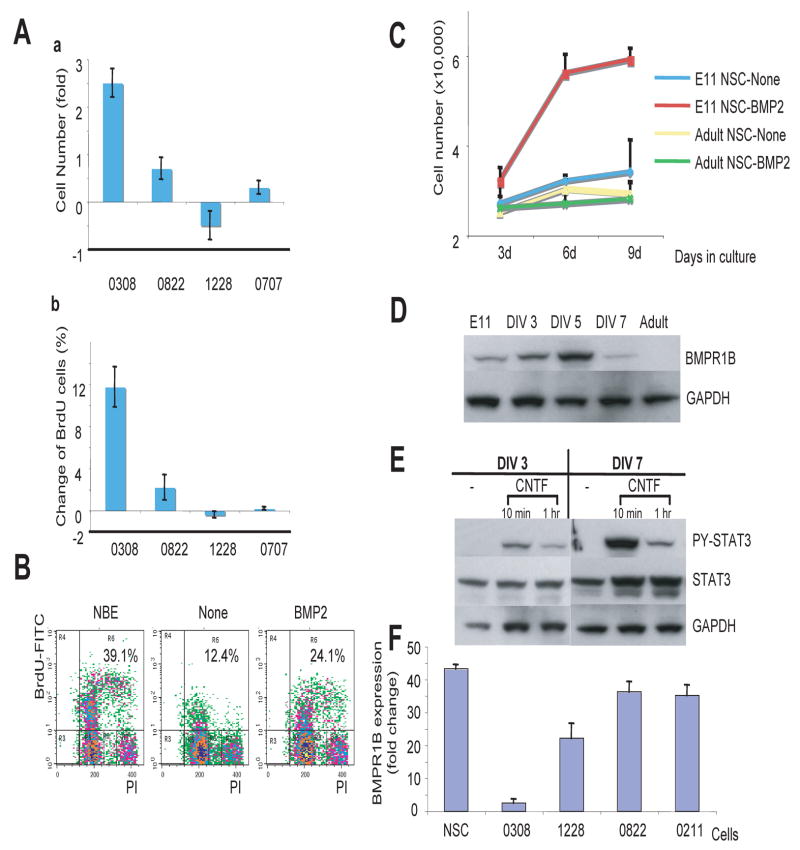
Figure 3. BMP induces proliferation instead of differentiation of 0308 TICs.
A) Proliferation kinetics of various TICs in the presence of BMP2. Cells were cultured with BMP2 (without FGF2 and EGF) for 6 days. Cell number (a) and BrdU positive cells (b) were counted and relative changes were calculated compared to non-treated cells. Error bars represent SD.
B) FACS analysis of BrdU incorporation in 0308 TICs. Percentages indicate BrdU-positive cells.
C) Proliferation kinetics of mouse NSCs from different developmental stages. Error bars represent SD.
D and E) Western blot analysis of BMPR1B and PY-STAT3 in serially cultured NSCs isolated from E11 brains and adult-SVZ derived mouse NSCs. DIV represents days in vitro. GAPDH was used to confirm equal loading of proteins.
F) Quantitative mRNA expression level of BMPR1B in various TICs and human NSCs determined by real time RT-PCR analysis. Error bars represent SD.

