
Figure 7. Methylation status of BMPR1B promoter in human GBMs.
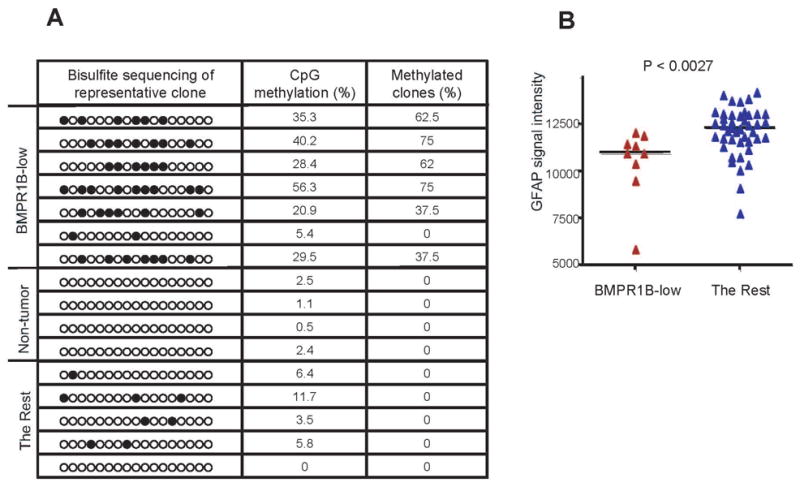
A) Methylation status of the BMPR1B promoter region in human GBMs. Each circle represents CpG nucleotides. The extent CpG methylation (%) and frequency of methylated clones were determined as shown in Figure 6. Eight clones for each sample were sequenced.
B) Correlation between the mRNA expression level of BMPR1B and GFAP in a subset of human GBMs. Expression levels of GFAP were compared between the BMPR1B-low mRNA expression group (defined as GBMs with more than 3 fold-reduction in median BMPR1B expression compared to all other GBMs) and all other GBM tissues. Median GFAP expression value was shown as a horizontal line. (two-tailed t test; p <0.0027).