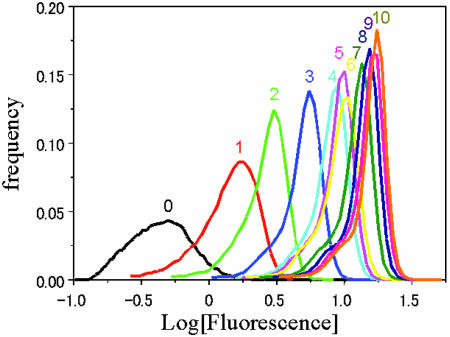
Fig. 1.
Histogram of the logarithm of fluorescence intensity for each generation, in the experiment described in the text. The number above the peak of each distribution indicates its generation number. We evaluated the fluorescence intensity of each E. coli in each generation by dividing its measured fluorescence intensity value (FL) by its forward scatter (FS) value measured with the cytometry, because the FS value roughly indicates the size of E. coli, whereas the FL value is usually proportional to the FS value.

