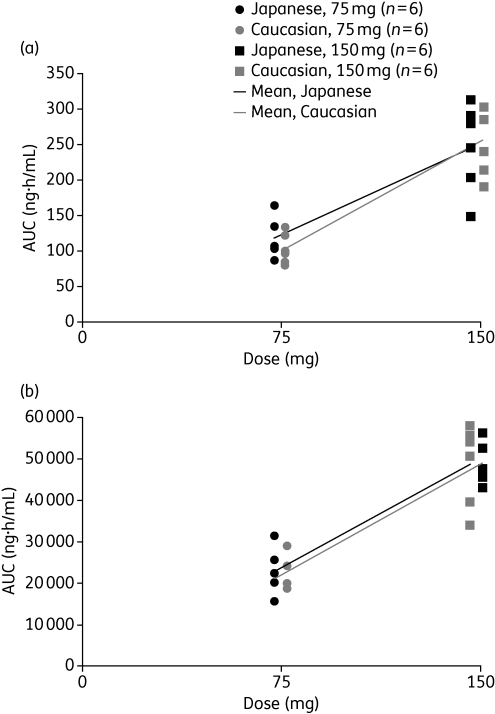
Figure 4.
Distribution of the mean and individual values of the area under the concentration–time curves from time 0 to 12 h post-dose (AUC0–12) for (a) oseltamivir and (b) oseltamivir carboxylate following 7 days of treatment with oseltamivir in healthy Caucasian and Japanese adult volunteers. Reproduced from Schentag et al.15 with permission.

