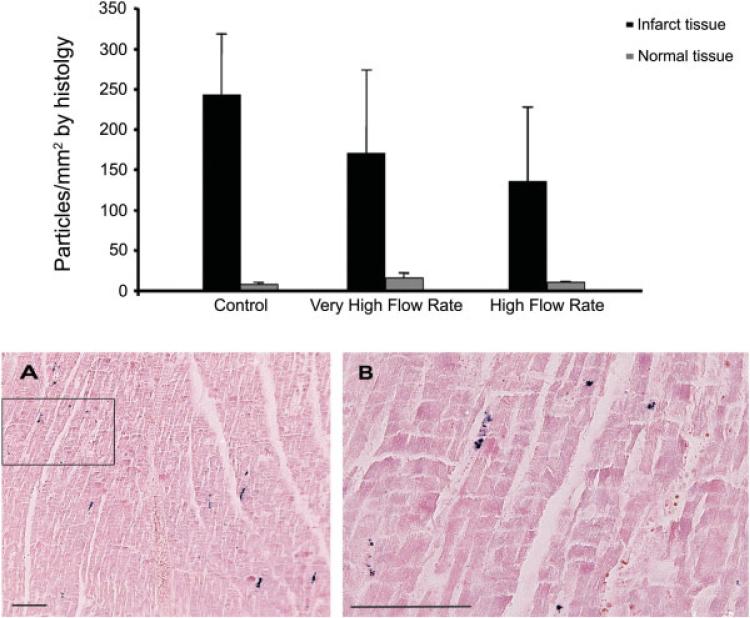
Fig. 5.
Concentration of Prussian blue-positive cells in the infarct and normal zones detected by histology. Upper panel: There was no significant difference in particle concentration in the infarct tissue among the 3 groups (P = 0.71). Results are expressed as mean ± SEM. Lower panel: (A) ×100 magnification of the infarct tissue showing Prussian Blue-positive mesenchymal stem cells following delivery at 60 ml/min (B) ×400 magnification of the black box in panel A. Bar indicates 100 μm. [Color figure can be viewed in the online issue, which is available at www.interscience.wiley.com.]

