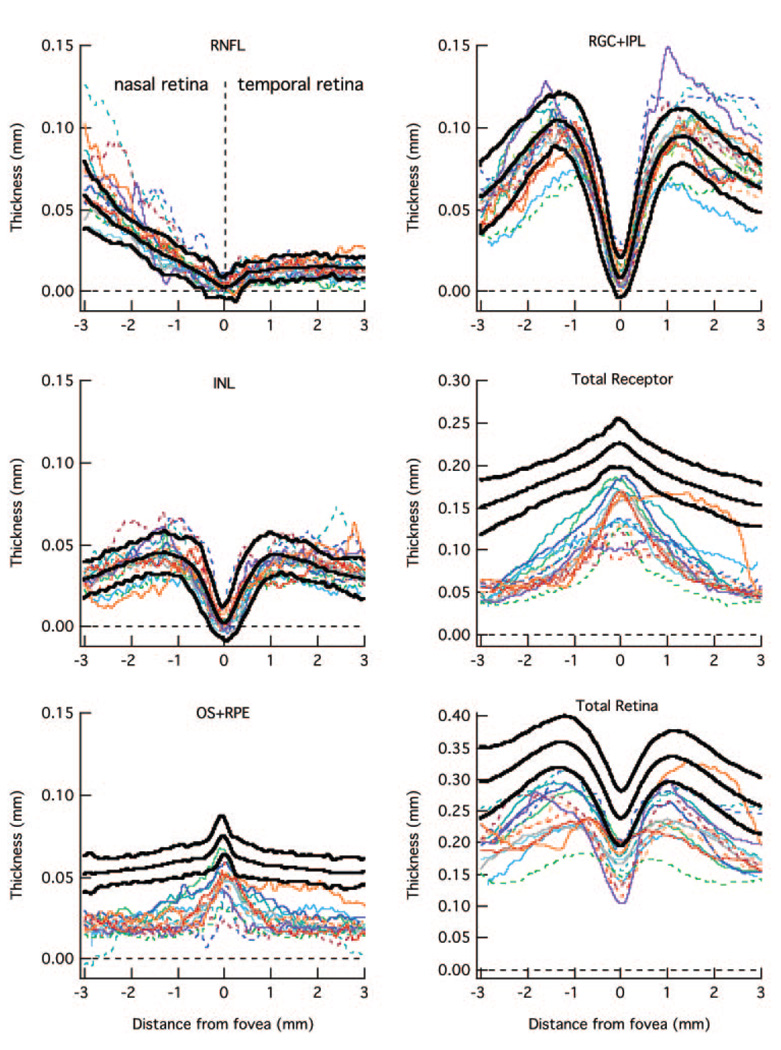
FIGURE 6.
The RNFL (A), RGC+ (B), INL (C), total receptor + (D), OS+ (E), and total retina (F) thickness curves are for 15 patients (colored lines) with the largest loss in receptor thickness (D) in the center fovea. The bold lines are the mean ± 2 SD for the controls from Figure 3.

