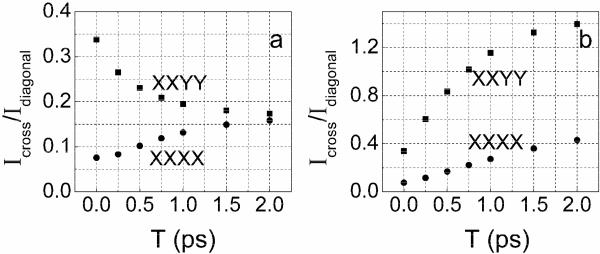
Figure 10. Simulated time dependence of the ratios of cross and diagonal peak intensities.
Simulated 2D IR absorptive spectra for XXXX (circles) and XXYY (squares) polarizations with the assumption of (a) 2π / 3 flips (as defined in the text) and no population exchange and (b) population exchange and no 2π / 3 flips between component states.

