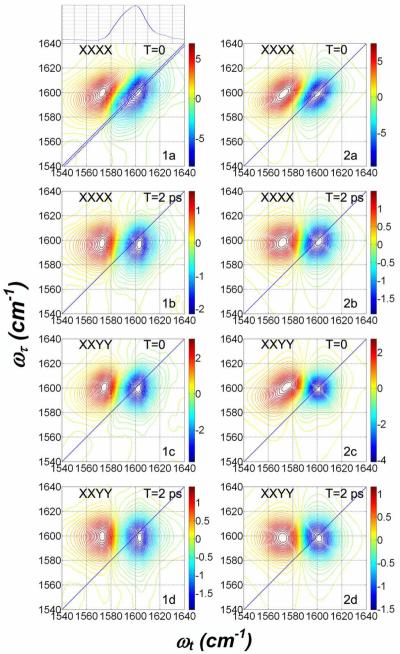
Figure 3. Polarization dependent absorptive spectra of 0.1 M DGdm+ in D2O.
Experimental spectra (1a–1d) at the two indicated waiting times, T. Simulation results (2a–2d) with parameters from Table 2. The plot situated above (1a) is the trace along the dotted diagonal line shown in (1a). The polarizations of the pulses are indicated on each subplot.

