
Figure 6. Cross peak dynamics.
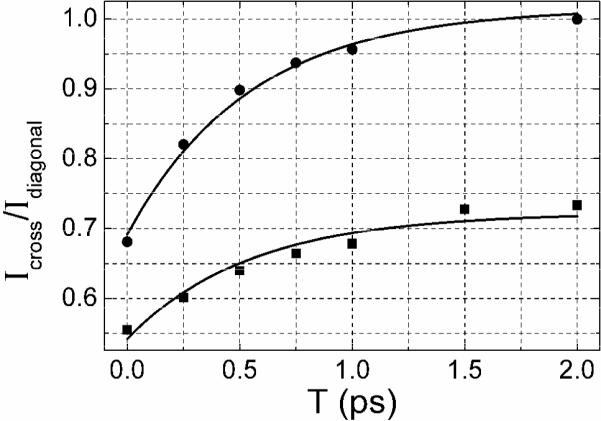
The ratio of the amplitudes between the cross peak at ωτ = 1585 cm−1 and the diagonal peak at ωτ = 1601 cm−1, both at ωτ =1601 cm−1. The polarizations are XXXX (squares) and XXYY (circles). The data refer to the 2D IR absorptive spectra of 0.133 M DGdm+ in 59% D-glycerol/D2O. Single exponential fits (as discussed in the text) are shown as solid curves.