
Figure 7. Energy diagram for the separated normal modes model.
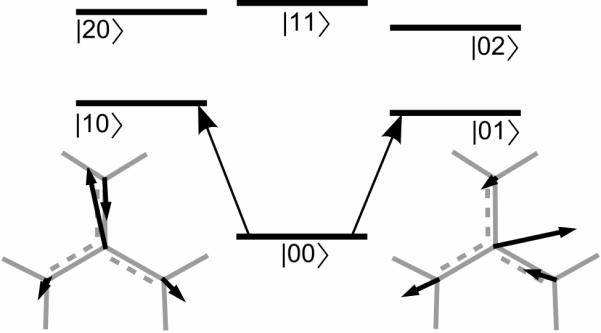
The displacements of the atoms of the CN3 group of DGdm+ for the two degenerate components of the 1600 cm−1 normal mode are shown. The atomic displacements illustrate the orthogonal polarization of the two transitions.