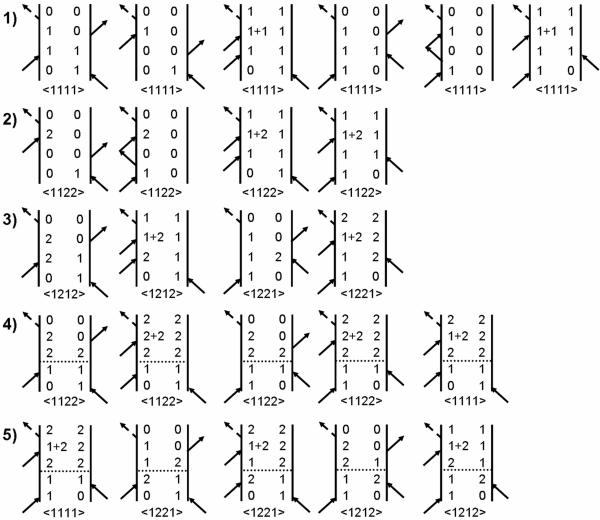
Figure 8. Liouville path diagrams for the photon echo signal emmited in the direction.
Rows 1 and 2 describe stimulated emission (population of state 1 during waiting time), ground state bleaching (ground state 0 during waiting time) and excited state absorption (coherence of 1+1 or 1+2 states and state 1 after the third interaction). Row 3 describes diagrams with interstate coherence during the waiting time. Rows 4–5 describe population and coherence transfer between modes during T due to the system-bath interaction. The horizontal dashed line implies that a spontaneous process occurs in the indicated interval. The complete set of diagrams needed for simulations includes those with indices 1 and 2 interchanged.

