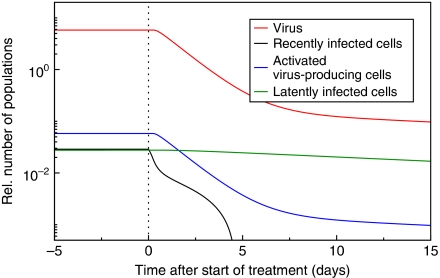
Figure 2.
An age-dependent transactivation model predicts biphasic viral load decline during antiretroviral therapy. Numerical simulations of the partial differential equation (PDE) model from Equation (1) accurately describe the first two phases. Recently infected cells become transactivated (black line) causing the initial shoulder phase of the viral load after treatment (red line). The virus load decays proportional to the number of activated virus-producing cells (blue line). The first phase of decline is followed by a slower second phase, which is caused by reactivation of latently infected cells (green line). Initially, the simulation is run to approach an equilibrium before the number of new infections, I(0,t), is set to zero (dotted line). Parameters are: r=0.019 d−1, α=0.039 d−1, δ=0.7 d−1, μ=0.0 d−1 and p/δV=100.

