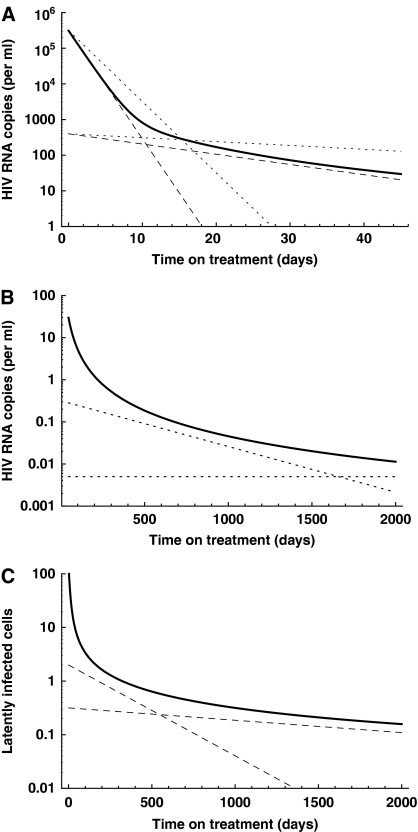
Figure 3.
Intracellular trans-activator of transcription (Tat) transactivation kinetics predict a decelerating decay during prolonged antiretroviral therapy. (A) Viral load decay within the first 45 days. The first phase results primarily from the death of activated virus-producing cells, whereas the second phase is determined by the reactivation of latently infected cells. Experimental estimates of the decay rates during the two phases are given by the dashed (Perelson et al, 1997) and dotted (Palmer et al, 2008) lines. (B) Decelerating decay during prolonged periods of therapy approximates experimental observations (dotted lines, Palmer et al, 2008). (C) Similarly, the pool of latently infected cells decays and approximates experimental estimates (dashed lines, Zhang et al, 1999; Finzi et al, 1999; Ramratnam et al, 2000; Siliciano et al, 2003). Parameters used: initial pool of activated, virus-producing cells A0=3.1 × 10⁷ cells (Chun et al, 1997), initial pool of latently infected cells I0=1.4 × 10⁶ cells (Chun et al, 1997), death rate of activated, virus-producing cells δ=0.7 d−1 (Perelson et al, 1997) and for simplicity we assume lifelong persistence of the resting CD4+ cells, i.e., μ=0.0 d−1 per day. In this figure, f(α) is a normal distribution with μ=0.2 and σ=0.1, truncated at zero and renormalized.

