
Fig. 2.
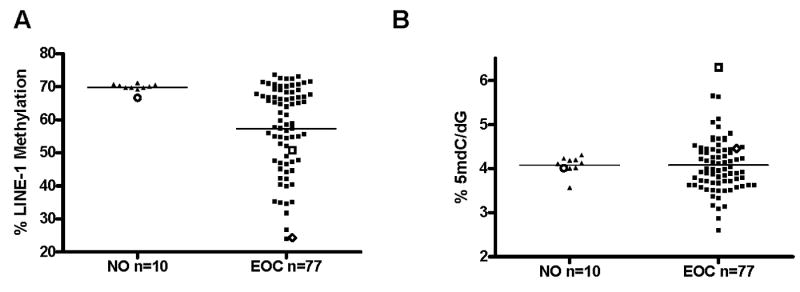
Global genomic DNA methylation in bulk NO and EOC tissue samples. A, LINE-1 repetitive element methylation was measured by quantitative bisulfite pyrosequencing. Bars signify the mean values of the data points, and the data points indicated by open symbols correspond to the samples shown in Fig. 1D. The difference between the two groups was statistically significant (unpaired, two-tailed t-test p=0.0014). B, Total genomic 5-methyl-2′-deoxycytidine (5mdC) levels were measured by LC-MS. Bars signify the mean values of the data points, and the data points indicated by open symbols correspond to the samples shown in Fig. 1D. The difference between the two groups was not significant (unpaired, two-tailed t-test p=0.7827), but sample variance was significantly greater in EOC (F test, p=0.0019).