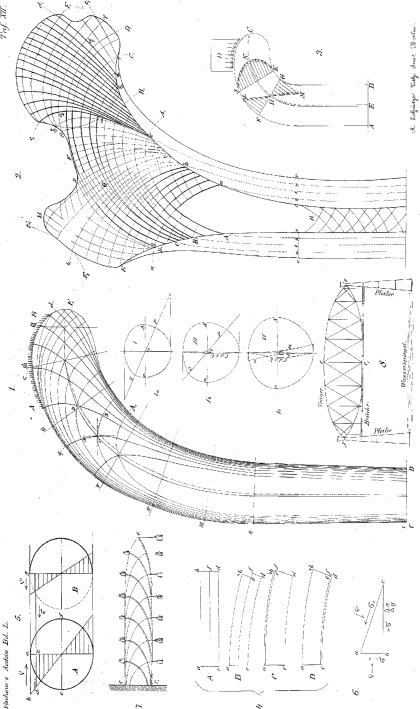
Table XII.
Figure 1. Depiction of the forces and trajectories in effect inside a bone. Based on the original drawn by the students of professor Culmann and under his supervision in double the original size of a human proximal femur. This original drawing was first photographically reduced back to the natural size and later lithographed. Figures 1a, b and c depict the force distribution for the exemplary chosen cross sections I, III and VI. Figure 2. Schematic reproduction of the specimen photographed in Figure 1, Table X. Figures 3–7 are part of the explanations on graphical statics on pp. 402–407. Figure 8. Schematic depiction of a bridge built according to Pauly’s system.

